UptimeHunt Documentation
Continuous availability monitoring for websites, APIs, and network services — from a distributed global probe network.
UptimeHunt
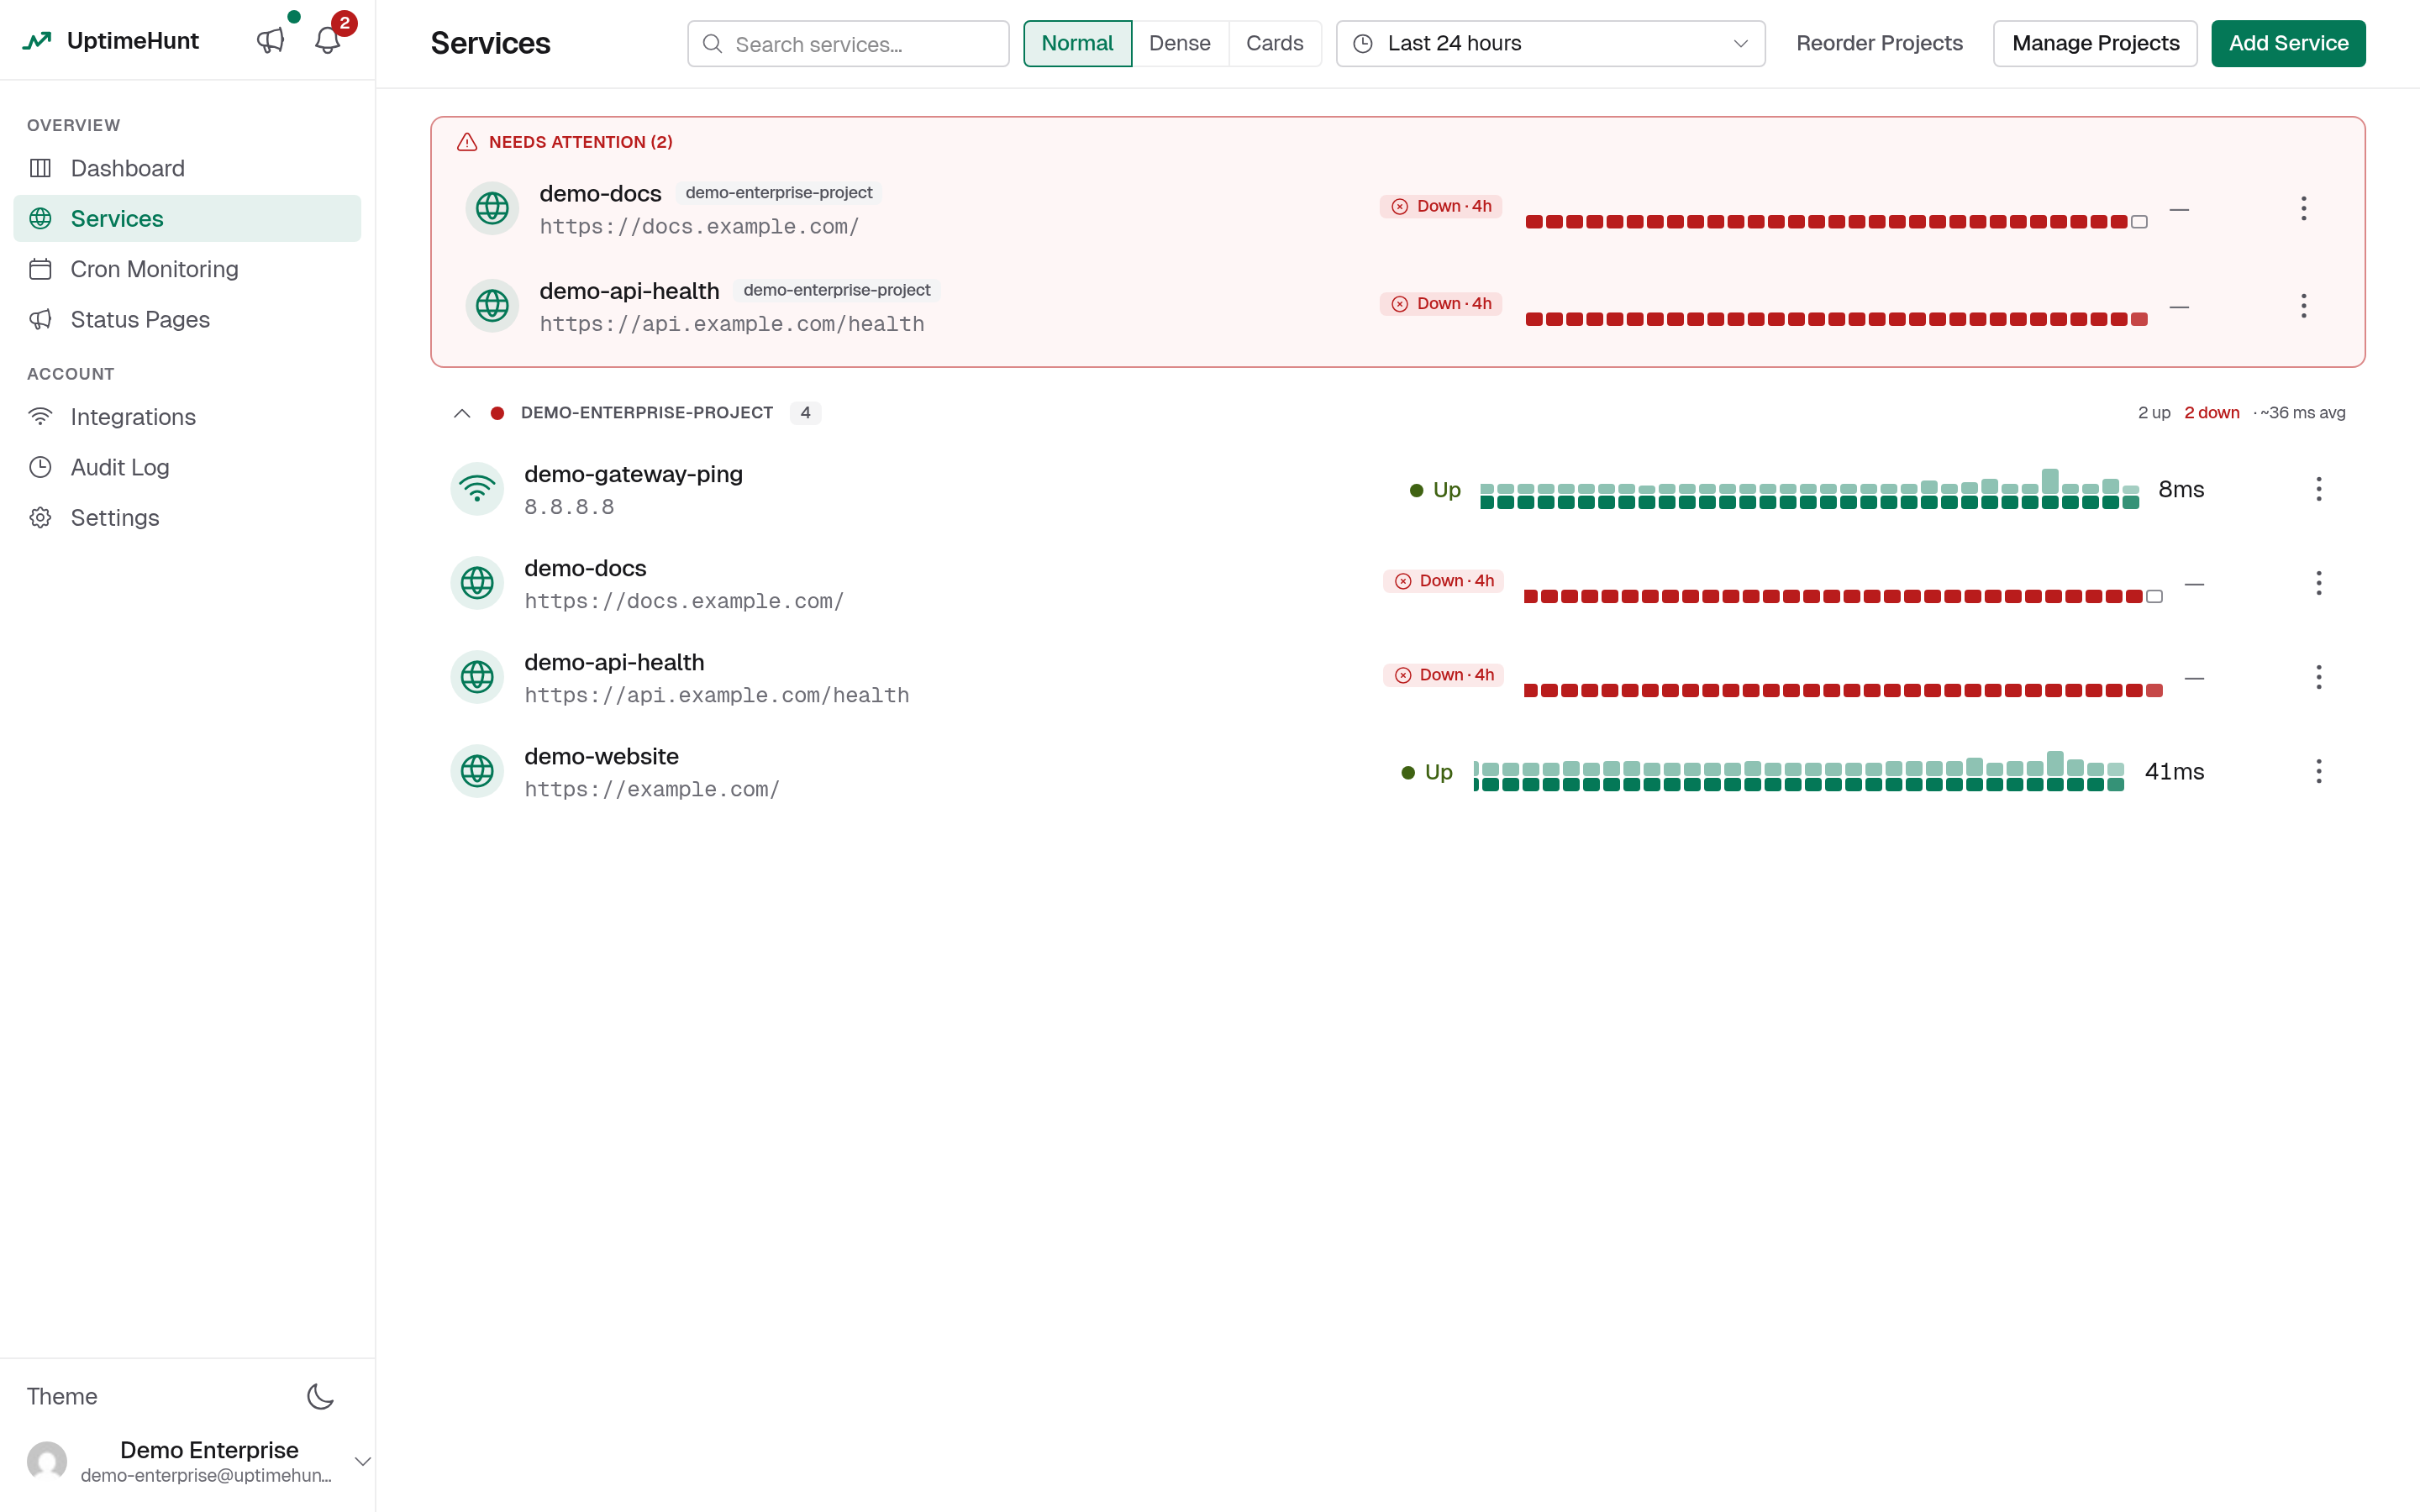
UptimeHunt monitors your websites, APIs, and network services from a distributed network of global probe locations. It checks each service on a schedule, records every result, fires alerts when something goes wrong, and keeps a history of incidents and performance data.
What would you like to do?
Get started
Create an account and set up your first monitoring service in minutes.
Understand how it works
Learn the core concepts: checks, probes, incidents, and expectations.
Configure monitoring
Dashboard, services, HTTP and ping checks, service details, and projects.
Set up alerting
Connect Slack, Discord, PagerDuty, email, webhooks, and more.
Manage probes
Global probe network, self-hosted probers, and Kubernetes auto-discovery.
API reference
Programmatic access to services, checks, probes, projects, and incidents.
How UptimeHunt works
- Configure a service — give it a URL or host, pick a check type (HTTP or ping), and set an interval.
- Probes run checks — distributed probe agents execute the check from multiple geographic locations on schedule.
- Results are recorded — every check result (status, response time, probe location) is stored and shown in the dashboard.
- Alerts fire on incidents — when the alert engine detects a pattern that crosses a threshold, it opens an incident and delivers notifications through your configured integrations.
- You investigate and resolve — the service details page shows check history, performance graphs, and probe-level breakdown to help you diagnose issues.
Supported check types
| Type | Monitors | Key metrics |
|---|---|---|
| HTTP/HTTPS | Websites, APIs, web endpoints | Status code, response time, SSL, response body |
| ICMP Ping | Servers, network devices | Reachability, round-trip time, packet loss |
Documentation sections
Getting Started
Account registration, sign-in, and creating your first service.
Concepts
Checks, probes, incidents, expectations, and organizations explained.
Monitoring
Dashboard, services, HTTP/ping configuration, service details, and projects.
Alerting & Integrations
Alert delivery via Slack, Discord, Telegram, PagerDuty, Opsgenie, and more.
Probes
Global probe network, private/self-hosted probers, Kubernetes auto-discovery.
Organizations
Team workspaces, roles, SSO, audit logs, and API token management.
Account
Profile, login methods, account merges, email management, and settings.
API Reference
REST API authentication, services, checks, probes, and projects.