Services Management
Create, edit, delete, and organize monitoring services including HTTP and PING checks within UptimeHunt.
Services Management
Quick Reference
- Create Service: Dashboard → "Add Service" button → opens a dedicated Add service page → pick a type → configure → Save
- Edit Service: "Configure" from a service row's menu, or "Edit Service" in details view → opens a dedicated Edit service page
- Delete Service: Click trash icon (or "Delete" from the row menu) → Confirm deletion (permanent action)
- Service Types: HTTP (websites/APIs), PING (network/servers), and more — see Monitoring Capabilities
- Organization: Group by projects, assign colors, manage from dashboard
Overview
This guide covers comprehensive service management operations including creating, editing, deleting, and organizing monitoring services within UptimeHunt.
Service Types
UptimeHunt supports multiple monitoring service types:
HTTP Monitoring
Monitor web endpoints, APIs, and web applications. Supports multiple HTTP methods, authentication, custom headers, POST data, and response validation.
PING Monitoring
Monitor network connectivity via ICMP ping. Supports IPv4/IPv6, domain resolution, round-trip time measurement, and packet loss detection.
Monitoring Type Comparison
| Feature | HTTP Monitoring | PING Monitoring |
|---|---|---|
| Primary Use | Websites, APIs, web applications | Servers, network devices |
| Protocol | HTTP/HTTPS | ICMP |
| Authentication | Yes (Basic, Bearer Token) | No |
| Custom Headers | Yes | N/A |
| Response Validation | Status codes, content | Reply received |
| Metrics Tracked | Response time, status code, content | Round-trip time, packet loss |
| IPv6 Support | Yes | Yes |
Creating Services
Creating (and editing) a service happens on its own dedicated page — /services/new — rather than in a popup dialog, so there's room for a full, sectioned form instead of a cramped modal.
Service Creation Workflow
- Navigate to the Services dashboard
- Click the "Add Service" button
- Pick a monitoring type from the type-picker cards at the top of the page (grouped by category — HTTP, PING, and the other monitoring capabilities)
- Work down the page's sections: Basics → type-specific settings → Expected results (+ Connection, for HTTP) → Monitoring locations → Alerts & notifications
- Click "Create service" in the sticky footer at the bottom of the page
Switching type keeps what it can
Changing the type-picker selection before saving keeps the fields every type shares (name, interval, project, icon) but clears any custom expectation rules you'd already started — a different check type has a different assertion catalog, so its rules can't carry over.
Common Configuration
All service types share these configuration options, in the Basics section:
Service Name (Required) — Descriptive identifier for the service. Displayed in dashboard and reports. Maximum 128 characters.
Project (Optional) — Project assignment for organization. Select from existing projects or leave unassigned.
Enabled (Toggle) — Controls whether monitoring is active. Enabled: Service is actively monitored. Disabled: Service configured but not monitored.
Check Interval (Required) — Frequency of monitoring checks in seconds. Default: 180 s (3 min). Minimum depends on plan — Free: 300 s, Pro: 60 s, Team: 30 s, Scale: 30 s, Enterprise: 30 s. 30 s is the platform-wide floor for every tier — see the changelog for why.
Icon — see Service Icon & Favicon Auto-Detection below.
Type-Specific Configuration
Each service type requires additional configuration, in its own section of the page:
HTTP Services
- URL endpoint
- HTTP method
- Authentication credentials
- Custom headers
- POST data
- Transport settings (IP version, request timeout) under Advanced Settings
PING Services
- IP address or domain name
- Transport settings (IP version, request timeout) in the Ping settings section
Refer to type-specific guides (HTTP, Ping) for detailed configuration instructions.
Expected Results (Rules Builder)
Every service has an Expected results section that defines what a healthy check result looks like — the same expectations the alert engine evaluates.
The rules builder always shows rows — there's no separate "default" vs "custom" mode to switch between. A brand-new service starts with the check type's built-in rule(s) already listed, each tagged default. Editing, adding, or removing a rule switches the whole list to tagged edited — the complete list, not just the row you touched, is what gets saved, so an untouched sibling rule is never silently dropped. Reset to defaults (shown once anything has been edited) clears every custom row and goes back to inheriting the check type's built-in default, whatever it evaluates to at the time.
Each row reads like a sentence, built from four independent controls:
- A subject dropdown — what to check (e.g. HTTP status, response body, response time, TLS certificate; the catalog is per check type).
- An operator dropdown — how to compare. Every subject now offers its whole supported operator set (equals, is one of, is not one of, at least, at most, under, over, in range, contains, does not contain, matches regex, does not match regex, exists — the exact set depends on the subject's kind), not one fixed, uneditable phrase. A subject with only a single possible operator (e.g. "chain is valid") skips the dropdown and states it as plain text instead.
- A value control that changes shape with the chosen operator — a chip picker, a min–max pair, a single input, or nothing at all.
- A Down / Degraded severity select.
Add rule opens a menu listing every subject the check type supports — pick one to append a fresh row for it. Use the row's trash icon to remove one, and Reset to defaults to clear all custom rows. Rows combine with implicit AND — every rule must pass for the check to be healthy — and a probe that can't connect at all is always Down regardless of any rule; rules only apply once the service actually responds.
Per-type assertion catalog
Which subjects are available, their default rule(s), and default severities depend on the check type — see that type's own guide (e.g. HTTP Response Validation, DNS) and Expectations for the full concept.
HTTP status codes and classes
The HTTP status subject's full operator set is is one of, is not one of, is in range, equals, at least, at most, under, and over. Choosing is one of or is not one of opens a chip picker: check off any of the five status classes (1xx–5xx, each covering its whole hundred-range) and/or add specific 3-digit codes — they combine freely, e.g. "any 2xx, 3xx, or 429". A freshly added is one of rule starts pre-filled with 2xx and 3xx as a starting point. is in range takes an inclusive minimum and maximum code; equals takes a single code; at least/at most/under/over each compare against a single numeric code — exactly the operators the two built-in default rows below are built from.
New HTTP services start with two built-in rows instead — HTTP status at least 200 and HTTP status under 400, both severity Down — together equivalent to "any 2xx or 3xx."
Response body and regular expressions
The Response body subject supports contains, does not contain, matches regex, and does not match regex. A regex pattern is bounded for safety before it's ever evaluated:
- Up to 200 characters.
- Rejected at save time if it matches a known catastrophic shape — a nested repeating group (
(a+)+) or a repeated group with overlapping branches ((a|a)+). A plain, disjoint alternation like(GET|POST)+is fine and left alone. - At evaluation time, only the first 8 KiB of the body is searched, under a 0.5-second time budget.
A pattern that can't be safely evaluated — it timed out, or no match was found within the checked 8 KiB prefix of a larger body — is treated as inconclusive, never as a failure: it neither passes nor fails the rule, so it can never open a false incident on its own.
TLS certificate
HTTP services get one combined TLS certificate subject with four fixed choices:
| Choice | Checks | Default severity |
|---|---|---|
| valid for at least N days | Days remaining until the leaf certificate expires | Degraded |
| is valid for host | The hostname you enter appears in the certificate's SAN list (its placeholder is pre-filled with the service's own host) | Down |
| chain is valid | The certificate chain verifies against a trusted root | Down |
| issuer contains | The issuing CA's organization name contains the text you enter (e.g. "Let's Encrypt") | Degraded |
Only chain is valid depends on Verify TLS certificate being on (see Connection below) — with verification off, that one assertion has no fact to read and evaluates to no verdict (skipped), never a silent pass. The other three — valid for at least N days, is valid for host, and issuer contains — read facts the prober captures for every HTTPS hop regardless of verify_tls, so they still evaluate against whatever certificate is presented, even an untrusted or self-signed one, and can genuinely fail and open a real incident.
Automatic TLS-expiry assertion is separate
"valid for at least N days" here is a rule you add yourself. HTTP services also have a standalone tls_expiry_min_days transport setting that auto-adds an equivalent assertion at Degraded severity — the two are independent and can both be present. See Automatic TLS-Expiry Assertion.
Default assertions by check type
| Check type | Built-in default | Severity |
|---|---|---|
| HTTP | Status at least 200 and under 400 (any 2xx/3xx) | Down |
| Ping | Packet loss under 100% (at least one reply gets through) | Down |
| DNS | At least 1 record returned | Down |
| SMTP | Banner code 2xx (200–299) | Down |
| SSH | Banner contains SSH- | Down |
| Game server | None — a server that answers at all is healthy | — |
See each check type's own guide (linked under Service Types above) for its complete assertion catalog.
Connection (HTTP)
For HTTP services, wire-level connection behavior — not assertions — lives in a Connection group in the request's own settings section, directly below the URL/POST-data fields and above Advanced Settings. It is not part of Expected results, because these settings change what the prober dials rather than what counts as a healthy response:
- Follow redirects — checkbox, default on. When checked, an additional up to N hops field (default
5) caps how many redirects the prober follows before failing the check. - Verify TLS certificate — checkbox, default on. Uncheck only for a staging/internal endpoint whose certificate you can't otherwise fix; prefer adding a
tls_expiry_daysrule in the builder above over disabling verification outright — remember that turning it off only affects the chain is valid rule above (it evaluates to no verdict instead of pass/fail); the expiry, host, and issuer-contains rules keep evaluating against whatever certificate is presented.
See Transport & TLS for the full enforcement details (both are actually enforced end-to-end by the prober, including on every redirect hop).
Monitoring Locations
Every service can run from every probe location, or from a specific set you pick:
- All locations (the default) — the check runs from every current probe worldwide and self-maintains: a probe location added to the platform later is picked up automatically, with nothing to update on your service.
- Specific — one mixed list of removable chips that can hold whole continents and individual countries side by side. A continent chip (for example All of Europe) is a living set: a new European probe location added to the platform later is adopted automatically, with nothing to update on your service. A country chip is a fixed pin: exactly that country, never widened. The "add location" picker is grouped by continent with an All of … row first in each group; while a continent is selected, its member countries show as included in that continent and can't be double-picked. Switching from All locations seeds one chip per continent — the same coverage, listed explicitly, and each continent keeps adopting its future locations (the only thing "Specific" gives up is a brand-new continent appearing later). At least one chip must remain — removing the last one is blocked with a hint to switch back to All locations instead.
Locations you don't select simply never run the check — there is no partial tier: every location that runs the check counts fully toward its state and alerting.
Alerts & Notifications
The Alerts & notifications section of the service's Edit page (/services/:id/edit) decides which integrations receive a notification for this service, and when an incident opens and closes. Toggle alerting on or off and check off which configured integrations should receive this service's notifications — a warning shows if alerting is on but nothing is selected to receive it. The same section holds the incident timing controls — Wait before opening, Wait before closing, and Failing locations needed — explained in full in Configuring Alert Rules. This section is saved together with the rest of the service in one Save.
Request Timeout
Every check type — HTTP, Ping, DNS, SMTP, SSH, and Game server — exposes a Timeout field: an optional per-check override in whole seconds, capped at the platform's absolute maximum of 120 s (under Advanced Settings for HTTP; directly in the type's own settings section for the rest). Leave it empty to use the platform default (~10 seconds); set it explicitly to give a slow endpoint more headroom, or to fail fast on one that should always respond quickly.
Your plan sets a lower ceiling
The 1–120 s range is the platform's absolute limit; your organization's plan caps it lower, and the field states and enforces the actual ceiling for your plan:
| Plan | Maximum check timeout |
|---|---|
| Free | 10 s |
| Pro | 30 s |
| Team | 30 s |
| Scale | 45 s |
| Enterprise | 60 s |
The cap is grandfathered: it only applies when a write actually changes a service's stored timeout. A service configured before the cap existed — or before a plan downgrade — keeps running at its old value, and editing an unrelated field never rejects a timeout you didn't touch. Lowering an over-cap timeout is still a change, so the new value must itself fit the plan.
See Timeout Configuration for how it interacts with retries and DNS/TLS/transfer time.
Service Icon & Favicon Auto-Detection
Click the small icon swatch in front of the Service Name field (in the Basics section) to open the icon control:
- Manual URL — paste any image URL directly.
- Detect from site — for HTTP services with a resolvable target URL, this button asks the backend to resolve the site's declared icons (
<link rel="icon">and friends, plus a/favicon.icofallback) and shows every discovered candidate as a clickable image preview; click one to use it. - Auto-suggest on create — on the Add service page only, once you stop typing a URL and the icon is still empty, UptimeHunt automatically resolves and fills in the best candidate. This never overwrites an icon you've set yourself (manually or via Detect from site), and a site with no discoverable icon is a quiet no-op — never an error.
- Clear — removes the icon override, falling back to the runtime default (the site's favicon, resolved at display time).
A failed or rate-limited detection simply finds nothing — resolving an icon is a convenience, never a blocker to saving the service.
Editing Services
Edit Service Configuration
Editing opens the same dedicated page as creating a service (/services/:id/edit), pre-filled with the service's current configuration — not a popup dialog. The type is fixed once a service exists (there's no type picker on the edit page).
Method 1: From the Services List
- Locate the service in the dashboard
- Open its row menu and click "Configure"
- The dedicated edit page opens with every section pre-filled
- Make your changes and click "Save changes" in the sticky footer
Method 2: From the Detail Page
- Click the service name to open its detail page
- Click the "Edit Service" button in the header
- The dedicated edit page opens with every section pre-filled
- Make your changes and click "Save changes" in the sticky footer
Unsaved changes are protected
If you navigate away — in-app, or by closing the tab — while the edit page has unsaved changes, UptimeHunt asks you to confirm before discarding them.
Editable Parameters
All service parameters can be modified:
- Service name, icon, project assignment, enabled status, check interval
- Type-specific settings (URL, IP, authentication, etc.)
- Expected results (the rules builder), and Connection settings for HTTP
- Monitoring locations
- Alerts & notifications routing — saved together with the rest of the service in one Save
Configuration Updates
Changes take effect immediately for the next scheduled check. In-progress checks use previous configuration.
Deleting Services
Delete Process
To remove a service:
- Locate service in dashboard
- Click the Delete icon (trash)
- Confirm deletion in dialog
- Service is permanently removed
Deletion Consequences
Service deletion is permanent and includes:
- Service configuration removal
- Historical check data deletion
- Performance metrics removal
- Alert configurations (when implemented)
Permanent Action
Service deletion cannot be undone. Ensure you have backed up any necessary data before deletion.
Batch Deletion
Batch deletion is not currently supported. Services must be deleted individually.
Service Status
Status Indicators
Services display current status:
Up (Operational) — Service responding successfully. Indicator: Green check mark. Last successful check displayed.
Down (Failing) — Service not responding or returning errors. Indicator: Red X mark. Error information available in details.
Pending — First check not yet completed. Indicator: Gray clock. Wait for first check interval.
Status Determination
HTTP Services
Status determined by:
- HTTP response received
- Status code 2xx or 3xx (configurable)
- Response time within timeout
- No connection errors
PING Services
Status determined by:
- ICMP echo reply received
- Packet loss below threshold
- Response time within acceptable range
Service Organization
Grouping by Project
Services are organized by project on the dashboard:
Assigned Services — Appear under their project section. Inherit project color coding. Grouped with related services.
Unassigned Services — Appear in "Unassigned" section. No project association. Can be assigned to project later.
Reordering Services
Service order within projects is currently not customizable. Services appear in creation order or alphabetically (implementation-dependent).
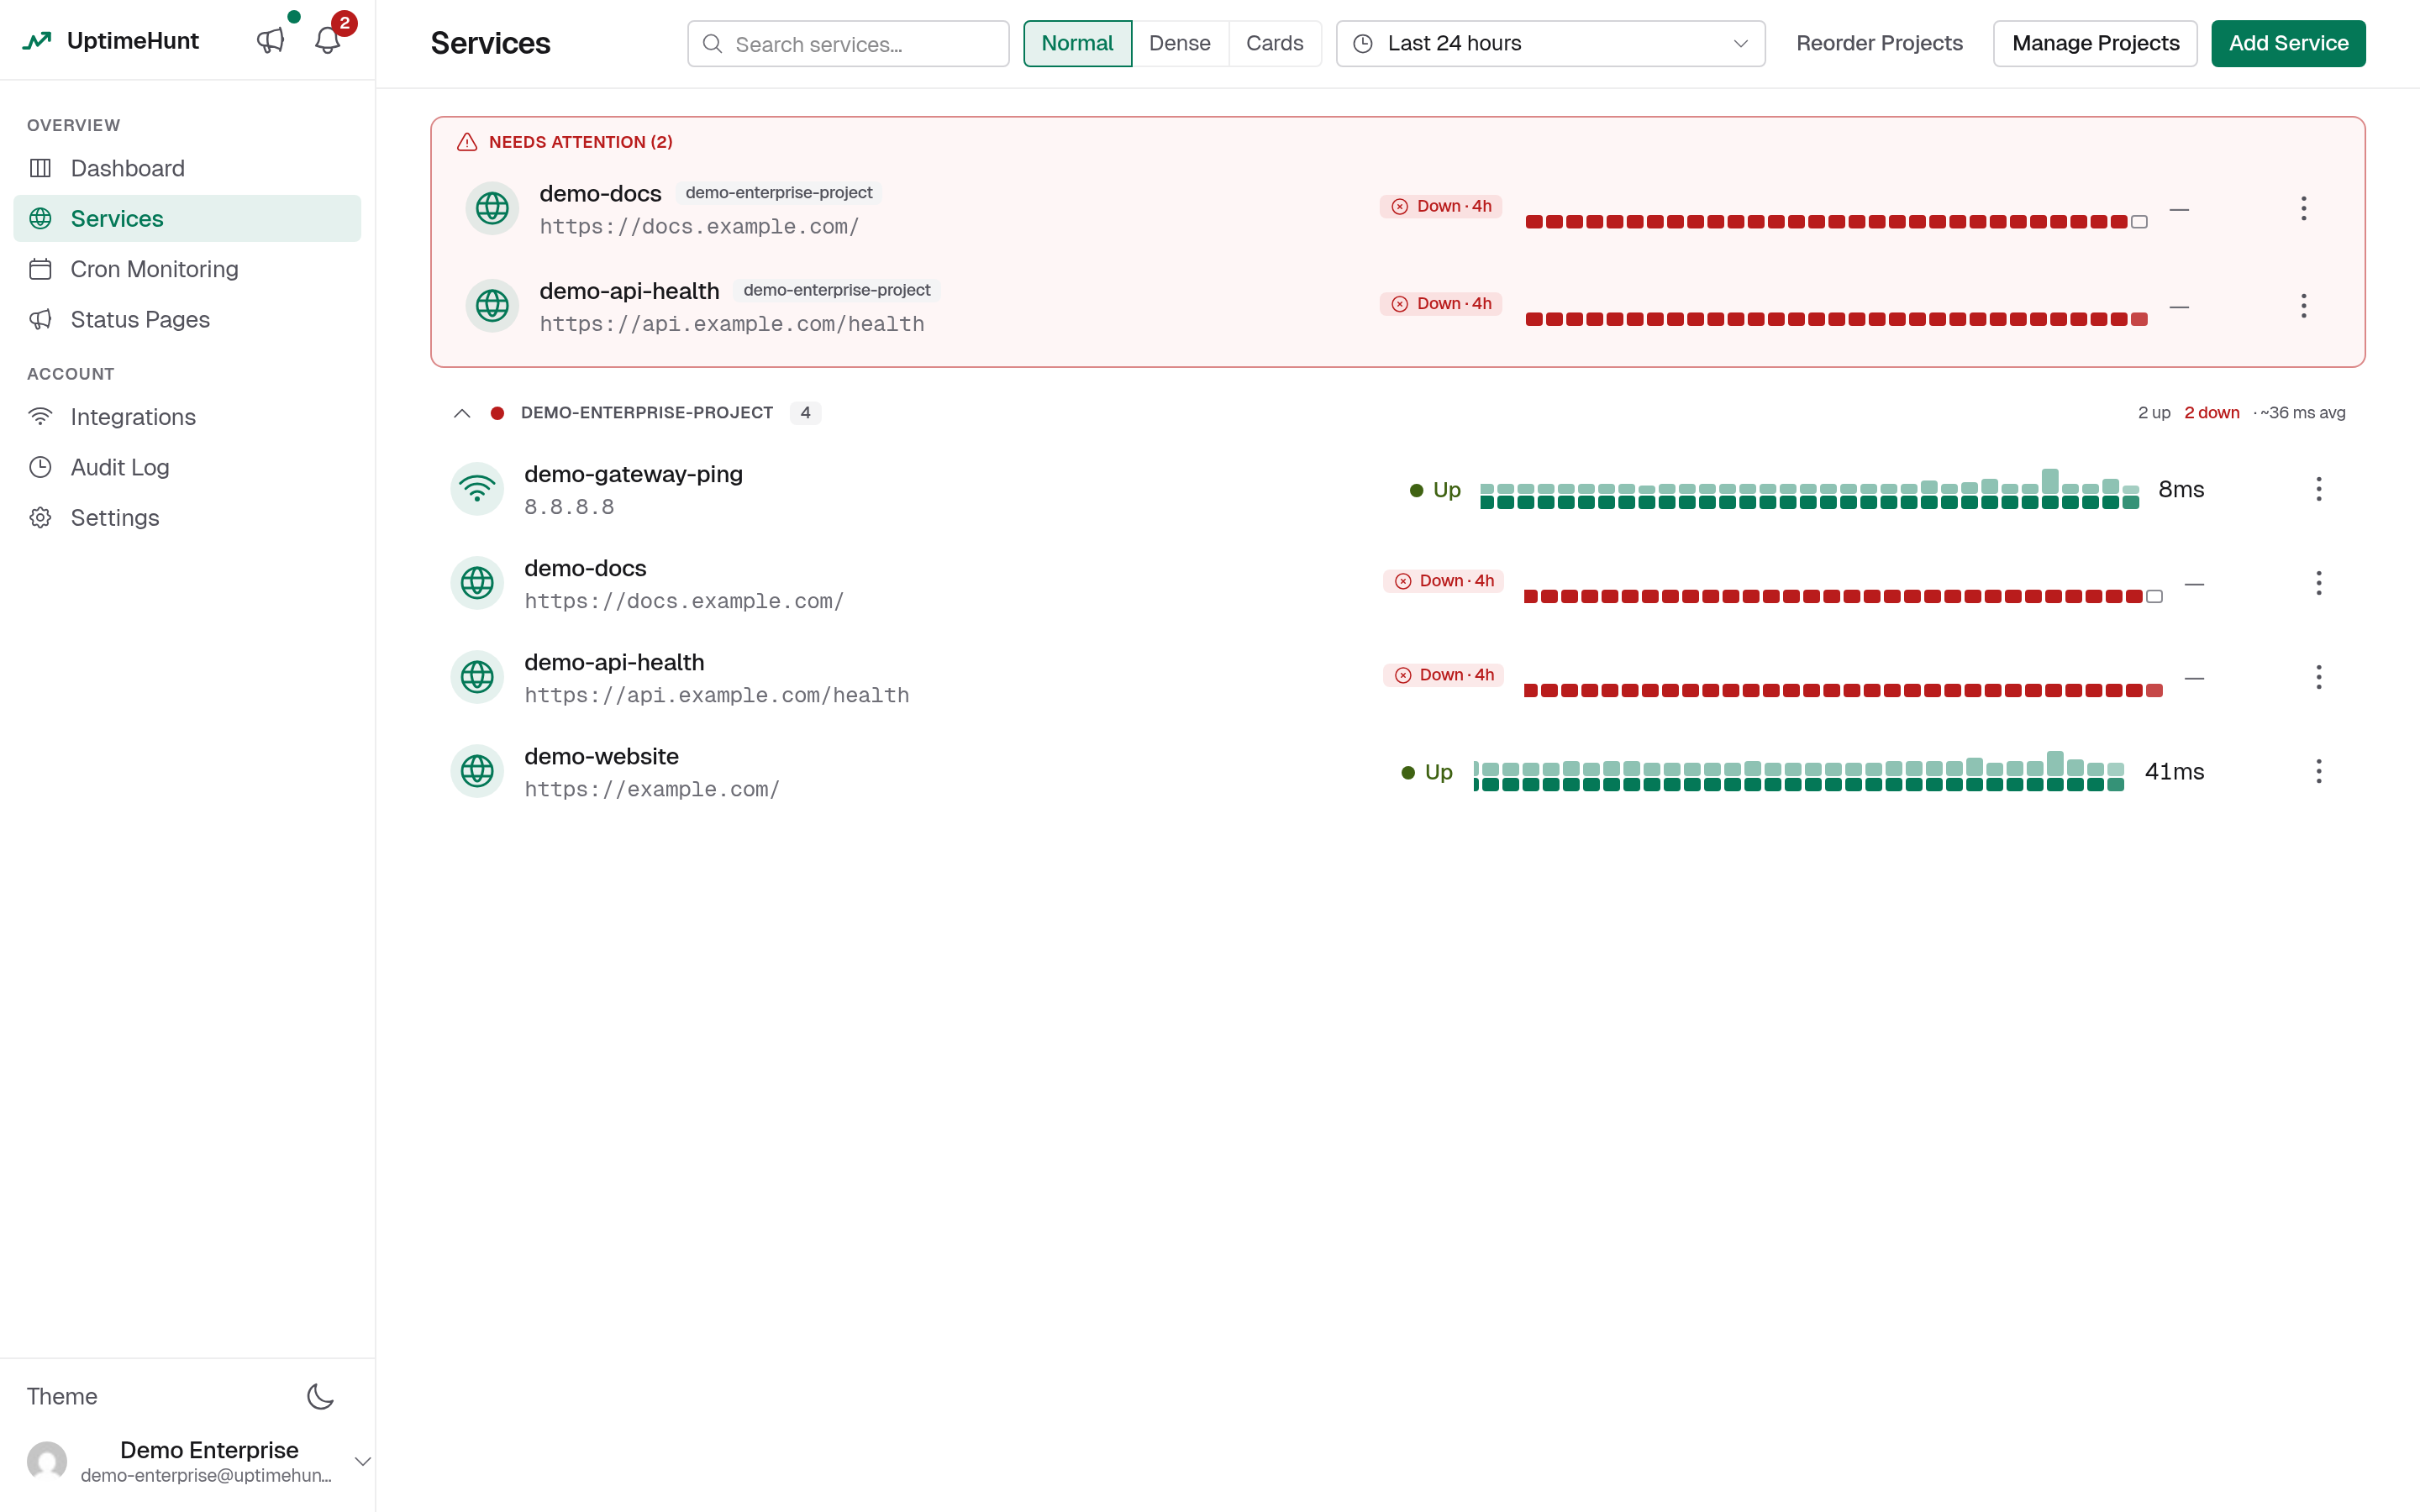
Service List Views
Grouping and Organization
All services are organized by project:
- Project Groups — Services grouped under their assigned project. Each group has a collapse/expand control to focus your view.
- Unassigned — Services with no project assignment appear in a separate section.
- Needs Attention — A section pinned at the top of your list surfaces any service that's currently down or degraded.
View Modes
Select your preferred view mode in Settings → Preferences → Lists layout — each option card shows a small schematic preview of the layout it produces, and the choice follows your account everywhere you sign in:
Normal View — Two-line rows, full detail. Shows the service name and target stacked, current status, per-cycle history ticks, and average latency. Balanced for scanning and detail.
Dense View — Single-line rows, max monitors per screen. Compresses rows and history strips for maximum service count per screen. Status and ticks remain visible and scannable. Best for accounts with hundreds of services or when space is limited.
Cards View — Displays services as cards in a grid layout. Each card shows the service name, target, status indicator, history ticks, and average latency. Better for visual scanning and touch-friendly interaction.
Normal and Dense views display each project group in its own quiet, bordered box on a flat page — a collapse/expand control, consistent spacing, and a column-header row (Normal) or tighter packed rows (Dense). Cards view is deliberately boxless: the group's eyebrow header sits above a bare grid of card tiles directly on the page, with no group container — each card keeps its own individual border, but the group itself isn't boxed. The needs-attention section and unassigned group remain pinned at the top, giving you quick access to services requiring action.
History Ticks
Each service displays per-cycle history ticks — small status blocks representing the recent check history. The strip packs each cycle's result as densely as the space allows, letting you see more history at a glance:
- Green — Up (the check succeeded)
- Amber — Degraded: some (but not all) probes reporting in the bucket failed transport reachability, or a result couldn't be attributed to any probe. Also used when a persisted incident marks the period degraded because an assertion failed while the target stayed reachable. A bucket only turns red when ALL probes reporting in it are down (a total outage) — a single failing probe out of many is degraded, never down.
- Red — Down (the check failed, or the target was unreachable)
- Gray hollow outline — Missed (no result arrived for a scheduled cycle — never rendered red)
- Current cycle — The rightmost tick updates live as the active check cycle progresses
Hover over a tick to see the check timestamp and result. The history strip height scales efficiently so you can fit more services on screen without sacrificing legibility.
Each bar's height now also encodes its response time, so a bucket that was merely slow visibly stands taller than a fast one at a glance, before you ever open the detail page. A missed cycle still renders as a fixed-height hollow block rather than collapsing to zero — no result means no data, not a fast result, so it must never look like the fastest bar on the strip.
Service Details View
Click a service name to navigate to its detail page, which shows:
- Complete configuration
- Check history table
- Performance metrics
- Probe location data
- Edit and management options
Bulk Operations
Currently Unavailable
The following bulk operations are not yet implemented:
- Bulk editing
- Bulk deletion
- Bulk enable/disable
- Bulk project assignment
- Batch export
Workarounds
For managing multiple services:
- Use projects for logical grouping
- Apply consistent naming conventions
- Document service purposes
- Use API for programmatic management
Service Limits
Account Limits
Service limits may apply based on account type:
Current Implementation
- No enforced limits (subject to reasonable use)
- Performance may degrade with excessive services
- Future plans may include tiered limits
Recommended Limits
For optimal performance:
- Standard accounts: Up to 100 services
- Consider performance impact of check intervals
- Balance between coverage and resource usage
Service Templates
Service templates are not currently implemented. Future versions may include:
- Predefined service configurations
- Template creation from existing services
- Template sharing capabilities
- Quick service deployment from templates
Import/Export
Current Functionality
Import and export features are not yet available.
Planned Features
Future releases may support:
- Service configuration export (JSON/YAML)
- Bulk service import
- Configuration backup
- Migration between accounts
Troubleshooting
Service Not Creating
If service creation fails:
- Verify all required fields are completed
- Check for validation errors in form
- Ensure service name is unique
- Verify URL/IP format is correct
- Review authentication credentials
Service Not Updating
If edits don't save:
- Check for form validation errors
- Verify you have edit permissions
- Refresh page and try again
- Check browser console for errors
Services Not Displaying
If services don't appear in dashboard:
- Verify you're logged into correct account
- Check that services weren't deleted
- Refresh the browser page
- Clear browser cache
- Try different browser
Status Not Updating
If service status seems stuck:
- Wait for next check interval
- Verify service is enabled
- Check service details for recent checks
- Ensure probers are operational
- Review check history for patterns
Best Practices
Naming Conventions
Use clear, descriptive names:
Good Examples:
- Production API - User Authentication
- Staging Website - Homepage
- Database Server - Primary (192.168.1.10)

Poor Examples:
- Service 1
- Test
- API
Configuration Management
Maintain consistent configurations:
- Document authentication credentials securely
- Use environment-specific projects
- Set appropriate check intervals
- Enable only necessary services
Monitoring Strategy
Develop effective monitoring:
- Monitor critical paths and dependencies
- Set realistic check intervals
- Balance coverage vs. resource usage
- Use appropriate monitoring types
Organization
Maintain clean service organization:
- Assign services to projects
- Use consistent color coding
- Remove unused services
- Document service purposes
Related Documentation
Dashboard Overview
The dashboard surfaces what just broke, what still needs attention, and your probe fleet's health — without drowning you in chronic noise.
HTTP Monitoring
Configure and use HTTP/HTTPS monitoring for websites, APIs, and web endpoints including authentication, custom headers, and POST data.